
math is beautiful in its way of making natural things/laws visible.
a form of communication that portrays dense and complex information in graphical form.
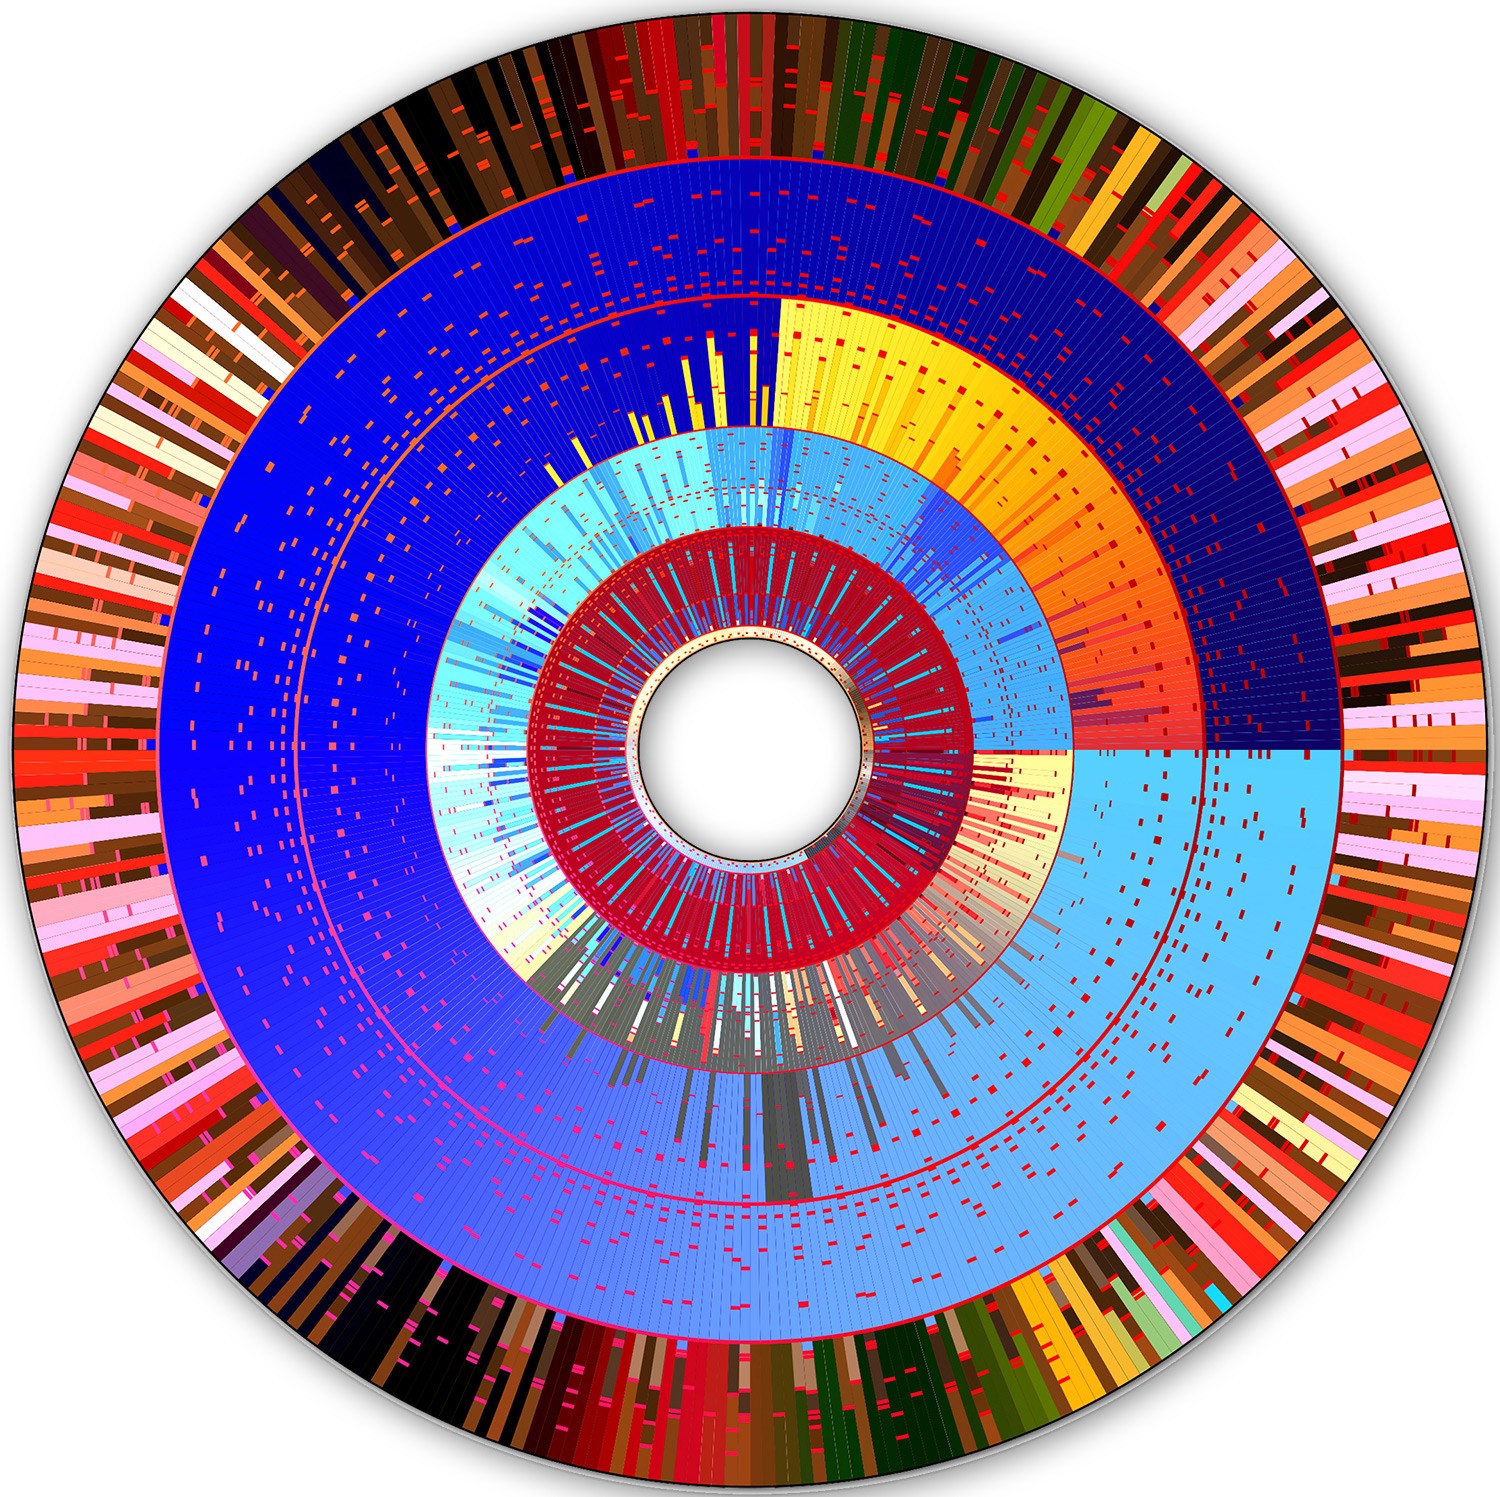
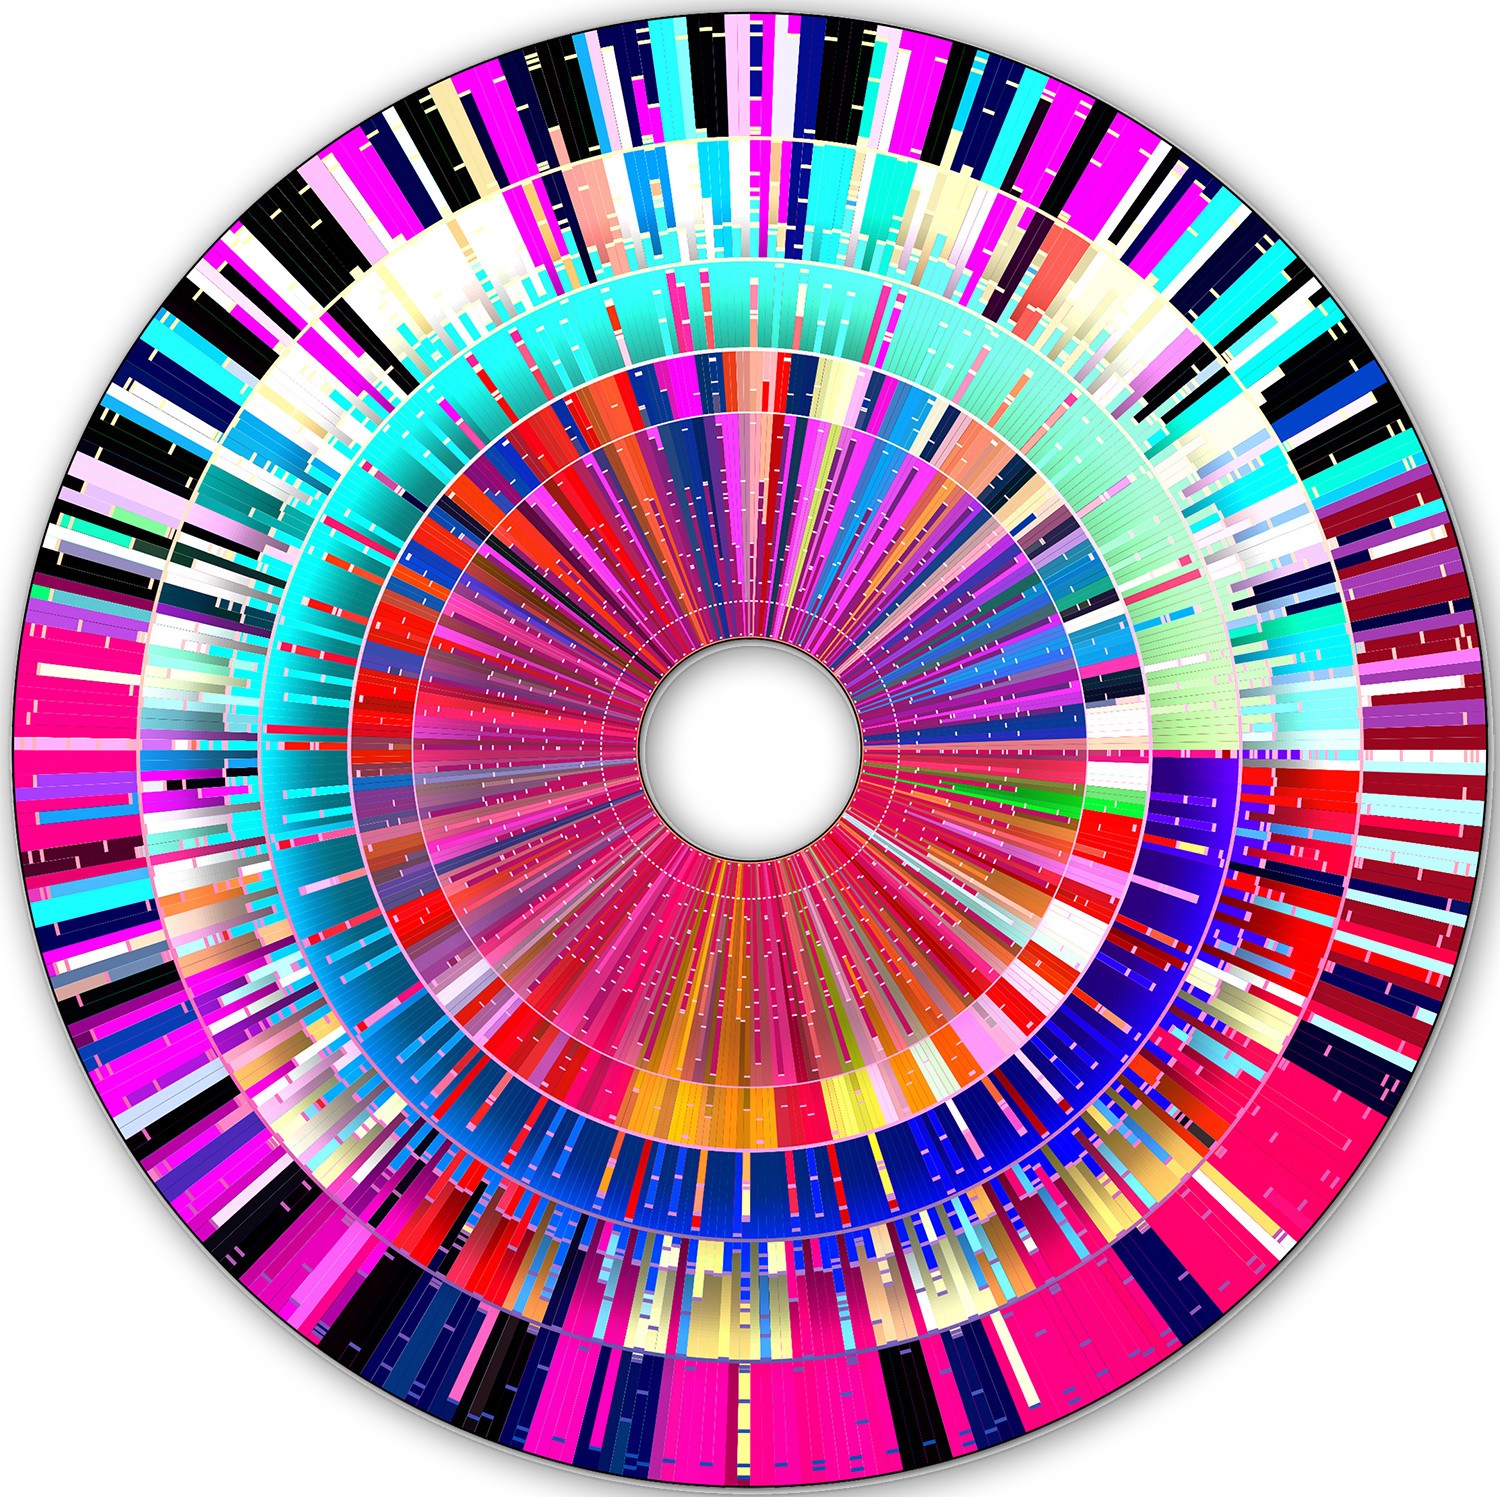
visualizing data by applying values to shapes, colors and algorithmic/geometrical structuring.
more and more shapes are added and superimposed, only to be thinned out and structured again later.
an ongoing process of modeling between input and output, finding a freeze, a final image. keeping only a few.
presenting information in a way that detaches itself from the actual purpose, becoming poetry.
data-disc, data-donut, data-star
holger lippmann, january 2022


